If you want see the graph of your Lambda function’s specific log messages’ count and create a CloudWatch dashboard widget out of it, you can have this setup:
Let’s have an example: Your Lambda function logs down a message like “Performed {x} operation for input {y}” and you want to watch when this happens, over a graph (widget) on a CloudWatch dashboard.
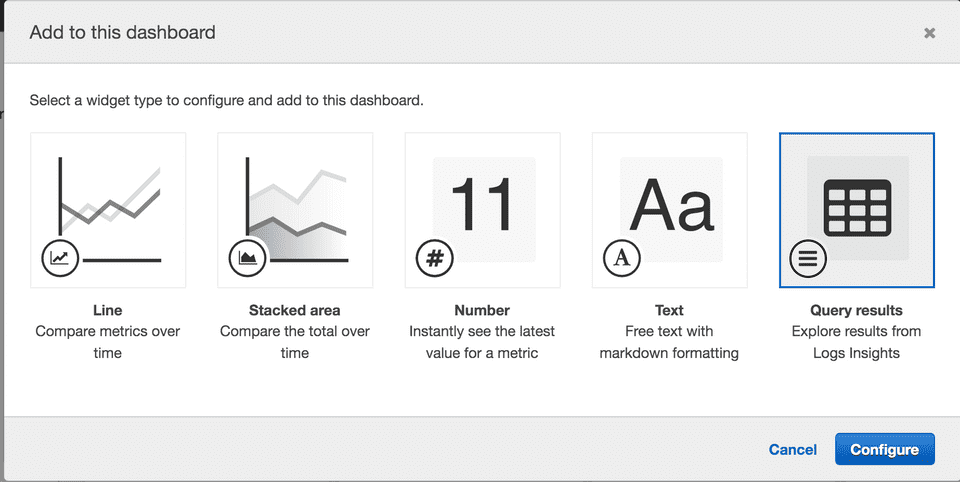
- Open up your dashboard and click on Add Widget -> Query Results and then Configure.
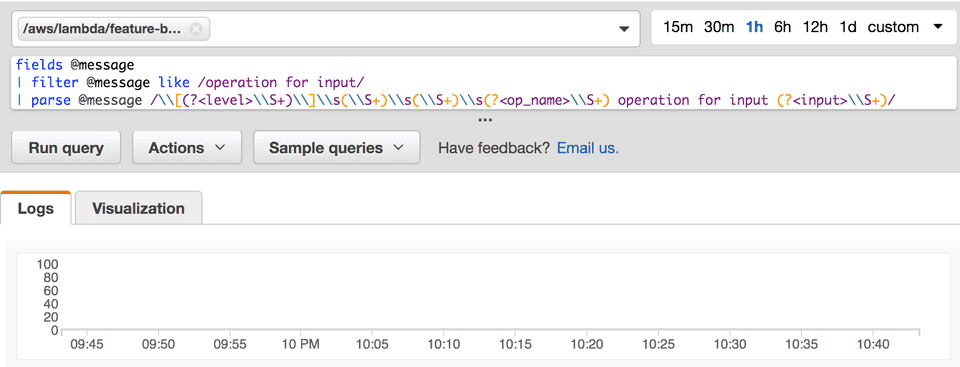
- Select your log group, which should be like
/aws/lambda/{your_lambda_name} - Put in your query, which is the most exciting part. Below is an example when you want to count the stats of a specific operation for your case. If you want to count the total number of times that this log message appears, then omit the filter part where you filter for the specific operation.
fields @message
| filter @message like /operation for input/
| parse @message /\\[(?<level>\\S+)\\]\\s(\\S+)\\s(\\S+)\\s(?<op_name>\\S+) operation for input (?<input>\\S+)/
| filter op_name == {op_name_you_want_to_watch}
| stats count(op_name) by bin(5m)
- Run your query and if all looks fine, also check the Visualization.
Then create your widget and enjoy watching your graph.

